

Economic scorecard 2023
Towards Tourism 2032: Phase one reporting November 2023
Objective: Total visitor expenditure continues to increase each year
Measure: Overnight visitor expenditure in Queensland
Overnight visitor expenditure (OVE) growth is strong (particularly domestic), however softening demand is expected, regional disparity remains, and international visitation remains lower than pre-COVID.
Overnight visitor expenditure in Queensland
| Year ending June 2023 | Year ending June 2022 | Annual % change | Change since year ending December 2019 | COVID-19 recovery status | |
|---|---|---|---|---|---|
| Intrastate | $15.0b | $12.4b | 21.0% | 47.1% | ✓ |
| Interstate | $13.8b | $7.2b | 90.9% | 49.7% | ✓ |
| Domestic total | $28.8b | $19.6b | 46.8% | 48.3% | ✓ |
| International | $4.3b | $0.7b | 512.6% | -28.7% | X |
| Total | $33.2b | $20.4b | 63% | 30% | ✓ |
Queensland total domestic and international OVE vs. target (rolling annual)
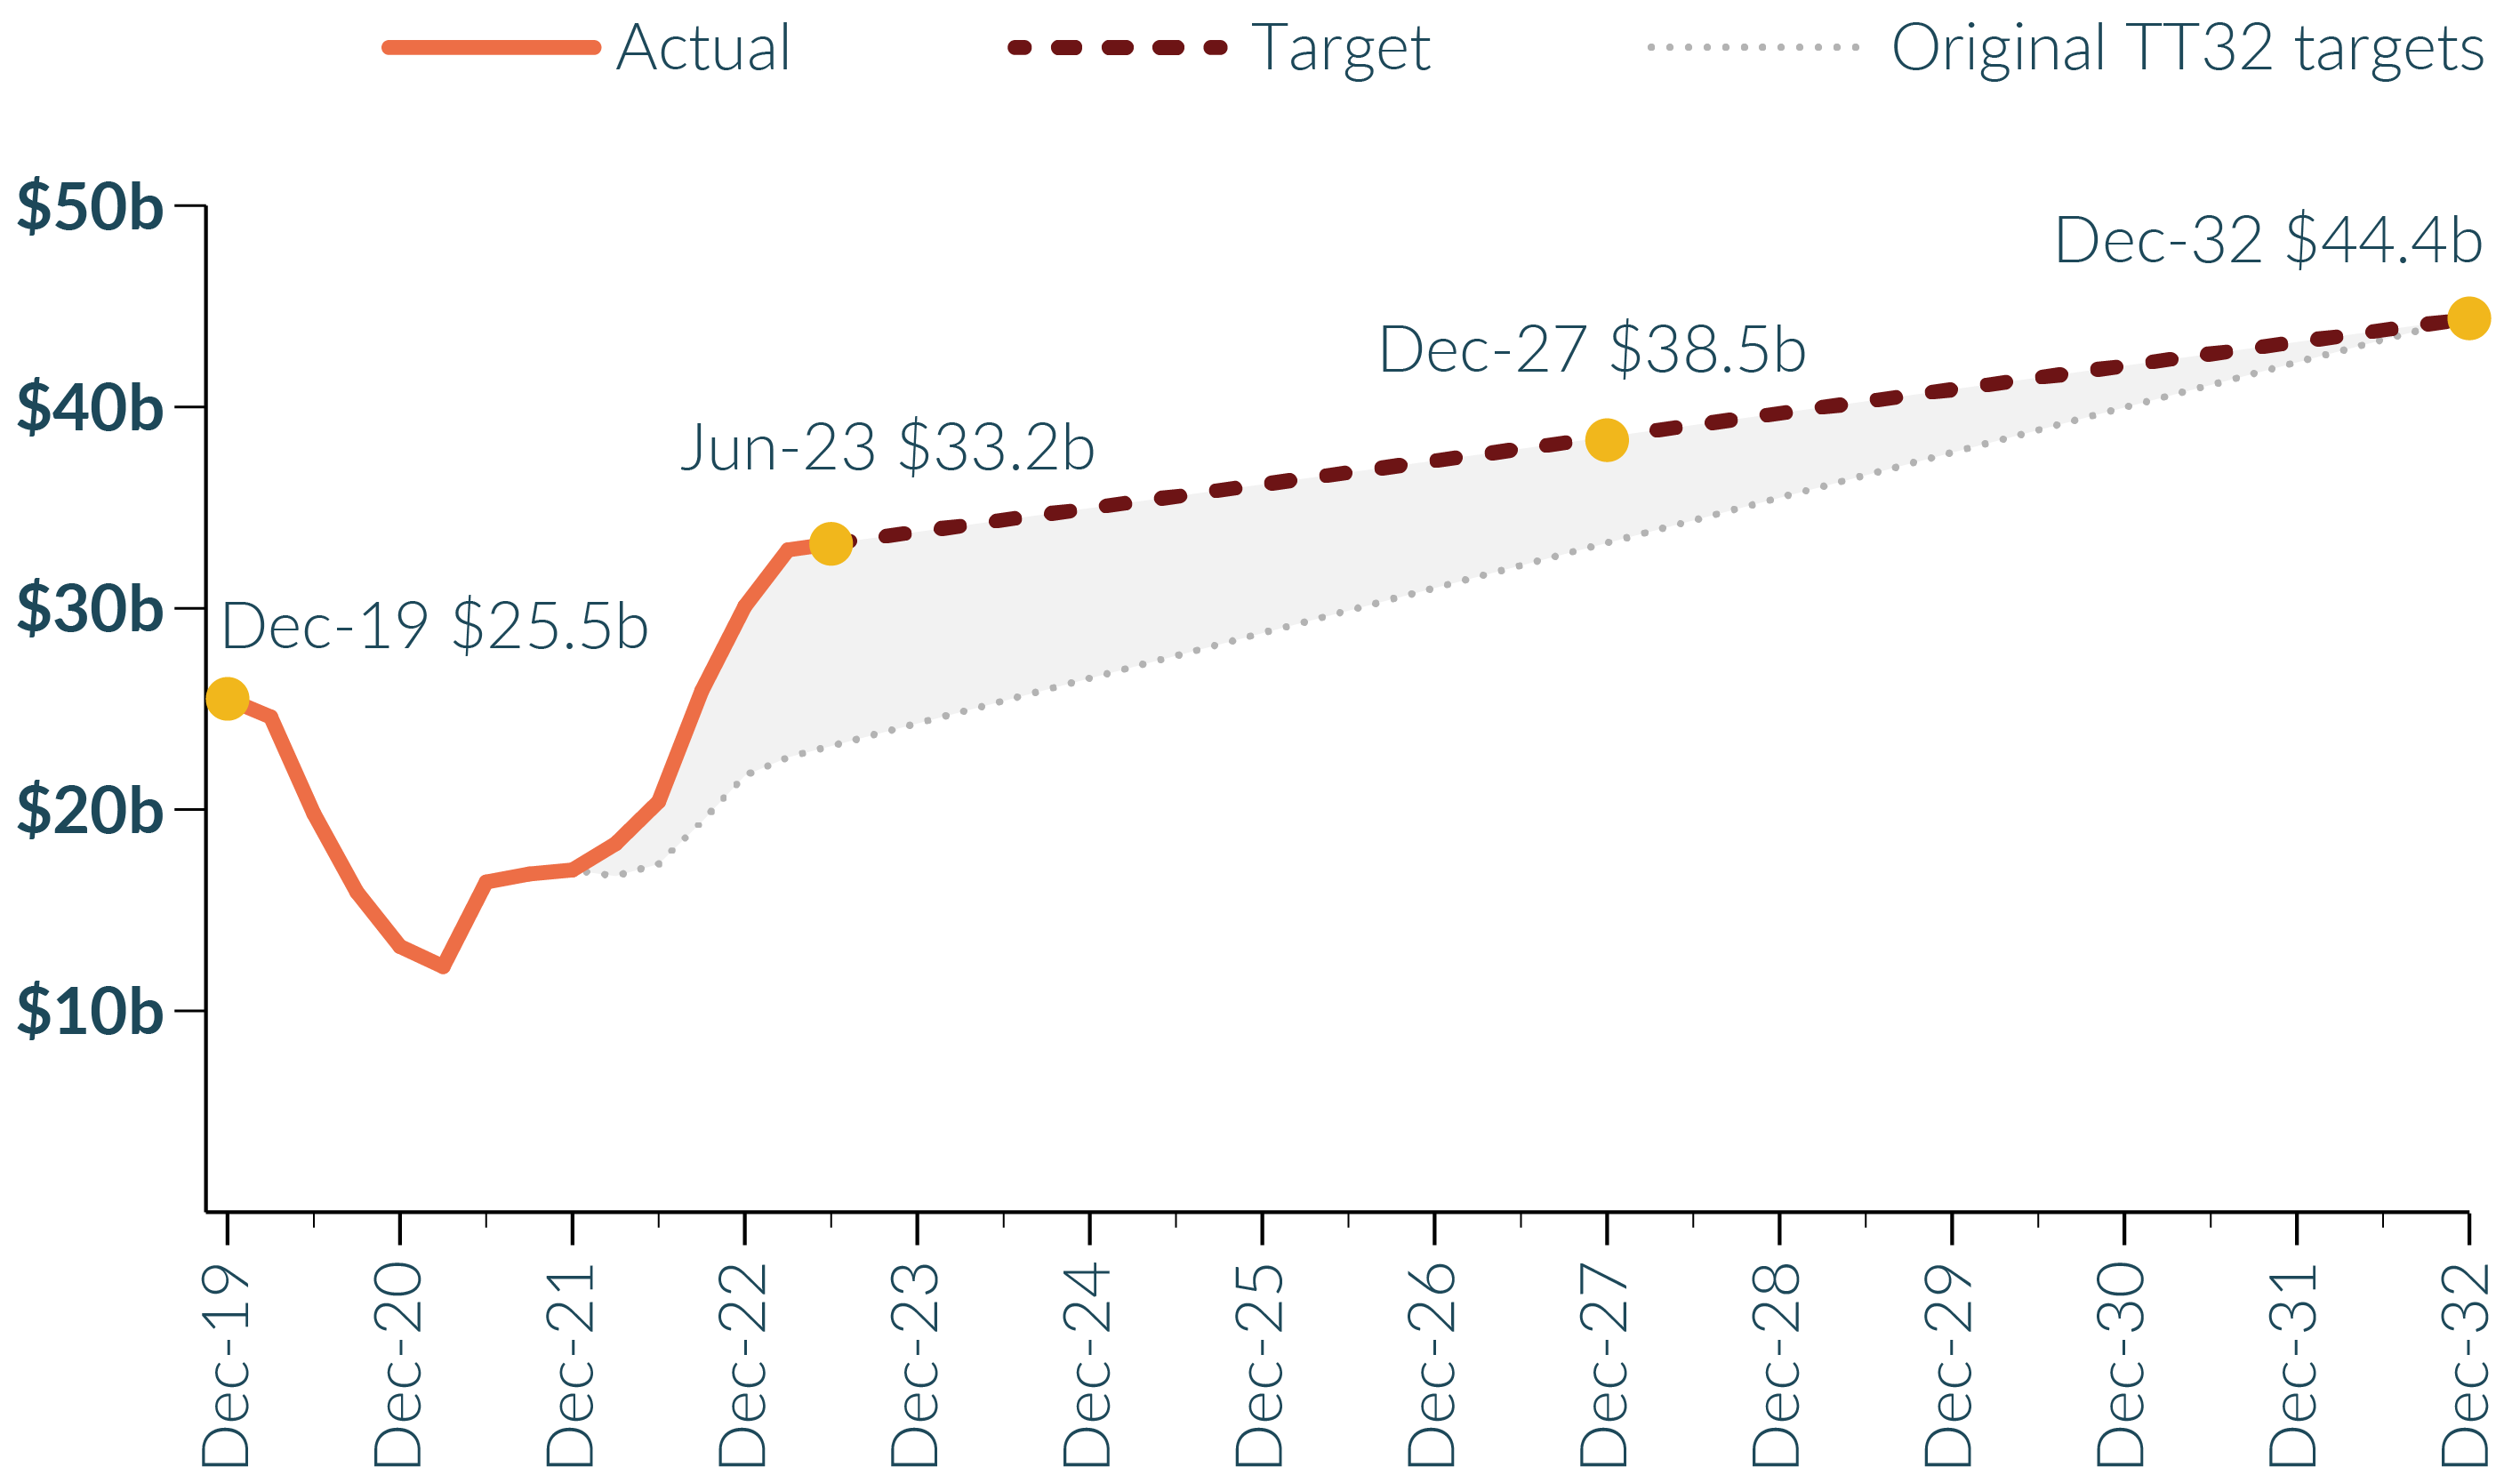
Source: Tourism Research Australia and BDA
Objective: More opportunities to visit, experience and stay are created and consumed
Measure: Total Tourism Gross State Product
The value of Queensland's tourism industry remains strong post-COVID.
Total Tourism Gross State Product
-
$15,685.1
Year ending June 2021 ($ million)
-
$21,501
Year ending June 2022 ($ million)
-
37.1%
% point change
Objective: The production and consumption of tourism continues to increase across all regions
Measure: Total Tourism Gross Regional Product
Tourism Gross Regional Product increased across all regions, through regional disparity exists.
Total Tourism Gross Regional Product
2020-21 ($ Million) | 2021-22 ($ Million) | Annual change % | |
|---|---|---|---|
| Gold Coast | $2,404.5 | $3,243.3 | 34.9% |
| Brisbane | $3,842.6 | $5,958.8 | 55.1% |
| Sunshine Coast | $2,379.0 | $2,814.8 | 18.3% |
| Fraser Coast | $409.4 | $486 | 18.7% |
| Southern Queensland Country | $706.1 | $934.5 | 32.4% |
| Mackay | $279.2 | $409.1 | 46.5% |
| Whitsundays | $520.4 | $730.1 | 40.3% |
| Townsville | $497.4 | $661.7 | 33.0% |
| Tropical North Queensland | $1,423.9 | $2,230.8 | 56.7% |
| Outback Queensland | $317.7 | $384.3 | 21% |
| Southern Great Barrier Reef* | $942.7 | $1,127.3 | 19.6% |
| Queensland (Queensland Gross State Product) | $15,685.1 | $21,501.0 | 37.1% |
Source: Tourism Research Australia
Objective: An increase in the number of tourism operators delivering exceptional customers experiences
Measure: Best of Queensland Experiences List (BOQE)
| 2019 | 2022 | 2023 | % point change | |
|---|---|---|---|---|
| Operators achieving BOQE status | 1,308 | 2,225 | 2,130 | -4.3% |
Decline in operators achieving BOQE status likely due to business and consultation and change in methodology of ATDW listings post-COVID.
Objective: Repeat visits for tourism are increasing
Measure: Return visits to Queensland
Repeat visitation remains high. Marginal decline in repeat leisure visitors to Queensland likely due to substitution effect following re-opening of international borders after surge in first time visitors to Queensland.
Share of repeat leisure visitors to Queensland
-
93%
June 2021
-
88%
June 2023
-
-5%
% point change
Source: Tourism and Events Queensland, unless stated otherwise.
* Southern GBR is an aggregation of Bundaberg, Capricorn, and Gladstone.
Last updated: 23 Nov 2023